TikTok virality is not the same thing as repeatable business demand. A product is only worth entering after it passes heat validation, conversion validation, and profit validation.
Authoritative Basis
- China Online Performance and Livestreaming Industry Report (2025): top-tier creators convert at around 15%, while mid- and lower-tier creators are often below 3%.
- Advertising Law, Article 38: influencer promotion must be supported by real and accurate data.
- Diffusion of innovation theory: many TikTok winning products are still in the early-adopter stage, with penetration below 15%.
1) A Costly Lesson: RMB 500,000 Lost by a Yiwu Seller
In 2025, a Yiwu seller saw a stress-relief toy on TikTok with millions of likes on a single video and stocked 100,000 units.
- TikTok signal: promoted by top creators, with more than 50,000 comments.
- Actual commercial result: only 23 monthly sales on Amazon, with search volume below 100 per month.
- Return rate hit 68% because of complaints about bad material odor.
Core mistake: the seller never verified commercial conversion data or supply-chain compliance.
Diffusion theory explains the gap well: TikTok attention does not equal mainstream demand. Cat-ear headphones may go viral on TikTok while still showing only 7% penetration on Amazon.
2) The 3-Step Validation Method
Step 1: Validate Whether the Heat Is Real
Suggested workflow in Nuozhou Cross-Border Analytics:
Creator-to-Product Fit
- Enter the product keyword and review the audience profile of related creators.
- Risk signal: users aged 18-24 account for more than 80% of the audience, while the product is meant for family buyers in older segments.
Interaction Quality
- Check whether the like-to-comment ratio is abnormal. A normal range is often 50-100:1.
- Risk signal: a ratio below 10:1 may indicate inauthentic engagement.
Sustained Content Output
- Review the publish-time distribution of related videos.
- Healthy signal: at least five related videos per week for three consecutive months.
Step 2: Validate Commercial Conversion on E-commerce Platforms
Key checks that can be completed in about five minutes:
| Validation Dimension | Healthy Signal | Risk Signal |
|---|---|---|
| Current market size | Amazon/Shopee monthly sales > 500 units | All-platform monthly sales < 50 units |
| Search relevance | TikTok hot term has Amazon search volume > 1,000/month | Search volume < 100/month |
| Competitive landscape | Fewer than 50 sellers and no dominant monopoly | More than 200 low-priced homogeneous sellers |
Example: the TikTok hot term “magnetic eyelashes” shows Amazon search volume of 12,300 per month, which supports a possible entry decision.
Step 3: Validate Profit Potential Through Pricing and Supply Chain
Three critical data comparisons:
Price Gap
- TikTok suggested selling price: $12.99.
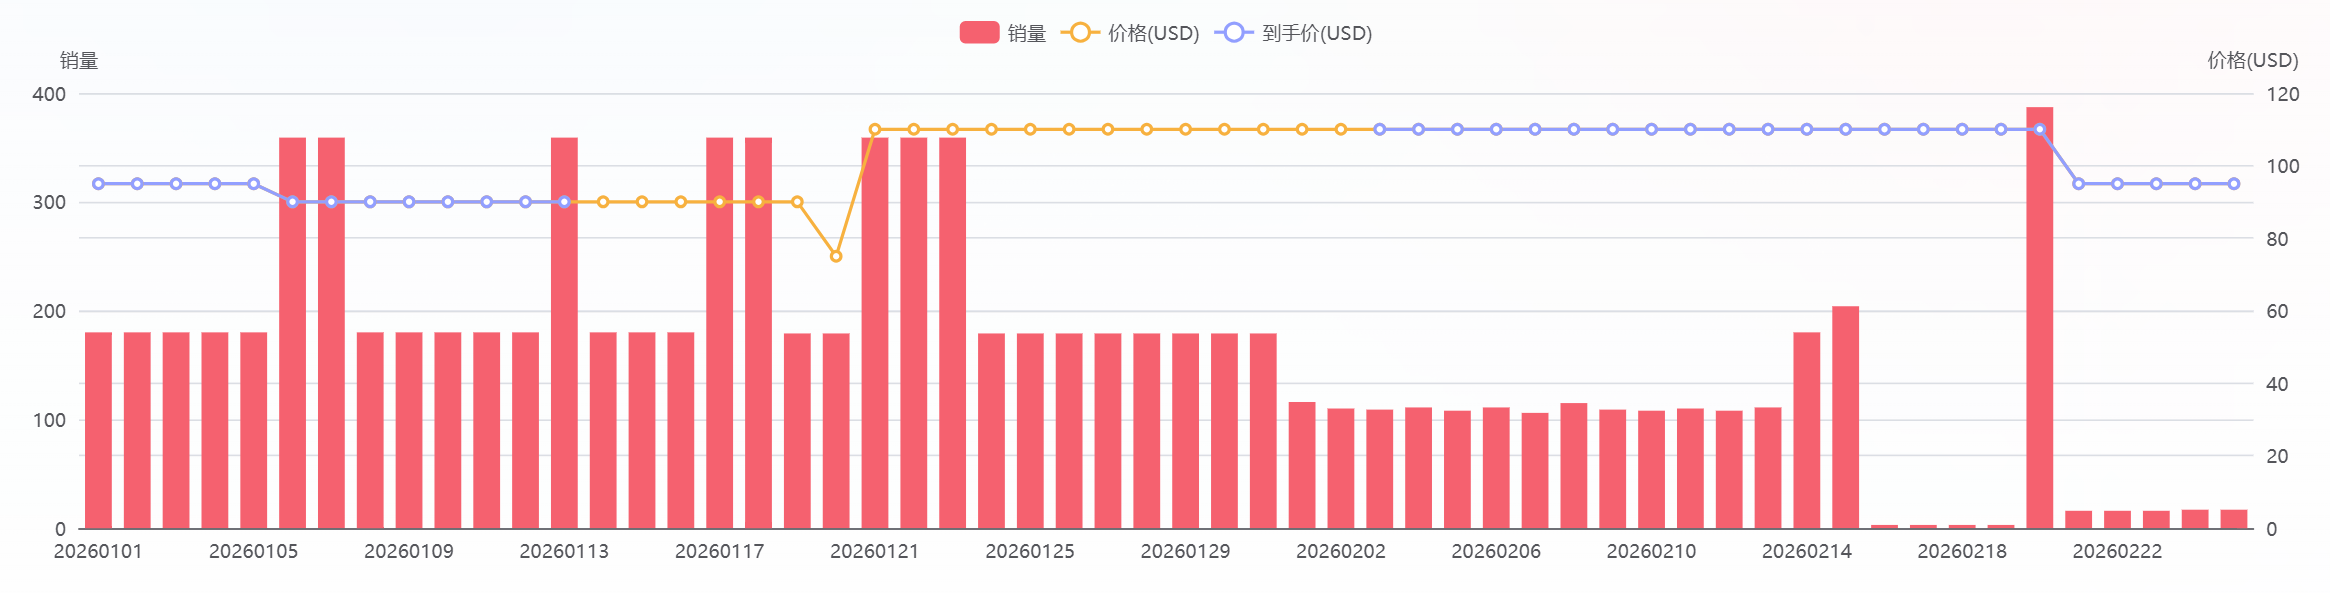
- Amazon transaction price: $9.99.
- If the gap is below $3, it becomes difficult to cover commissions and logistics.
Cost Reality
- 1688 sourcing cost: RMB 15 (about $2.1).
- Gross margin = ($9.99 - $2.1 - $4.5 logistics) / $9.99 = 33%.
- At that level, the product is only around break-even after additional operating costs.
Upgrade Headroom
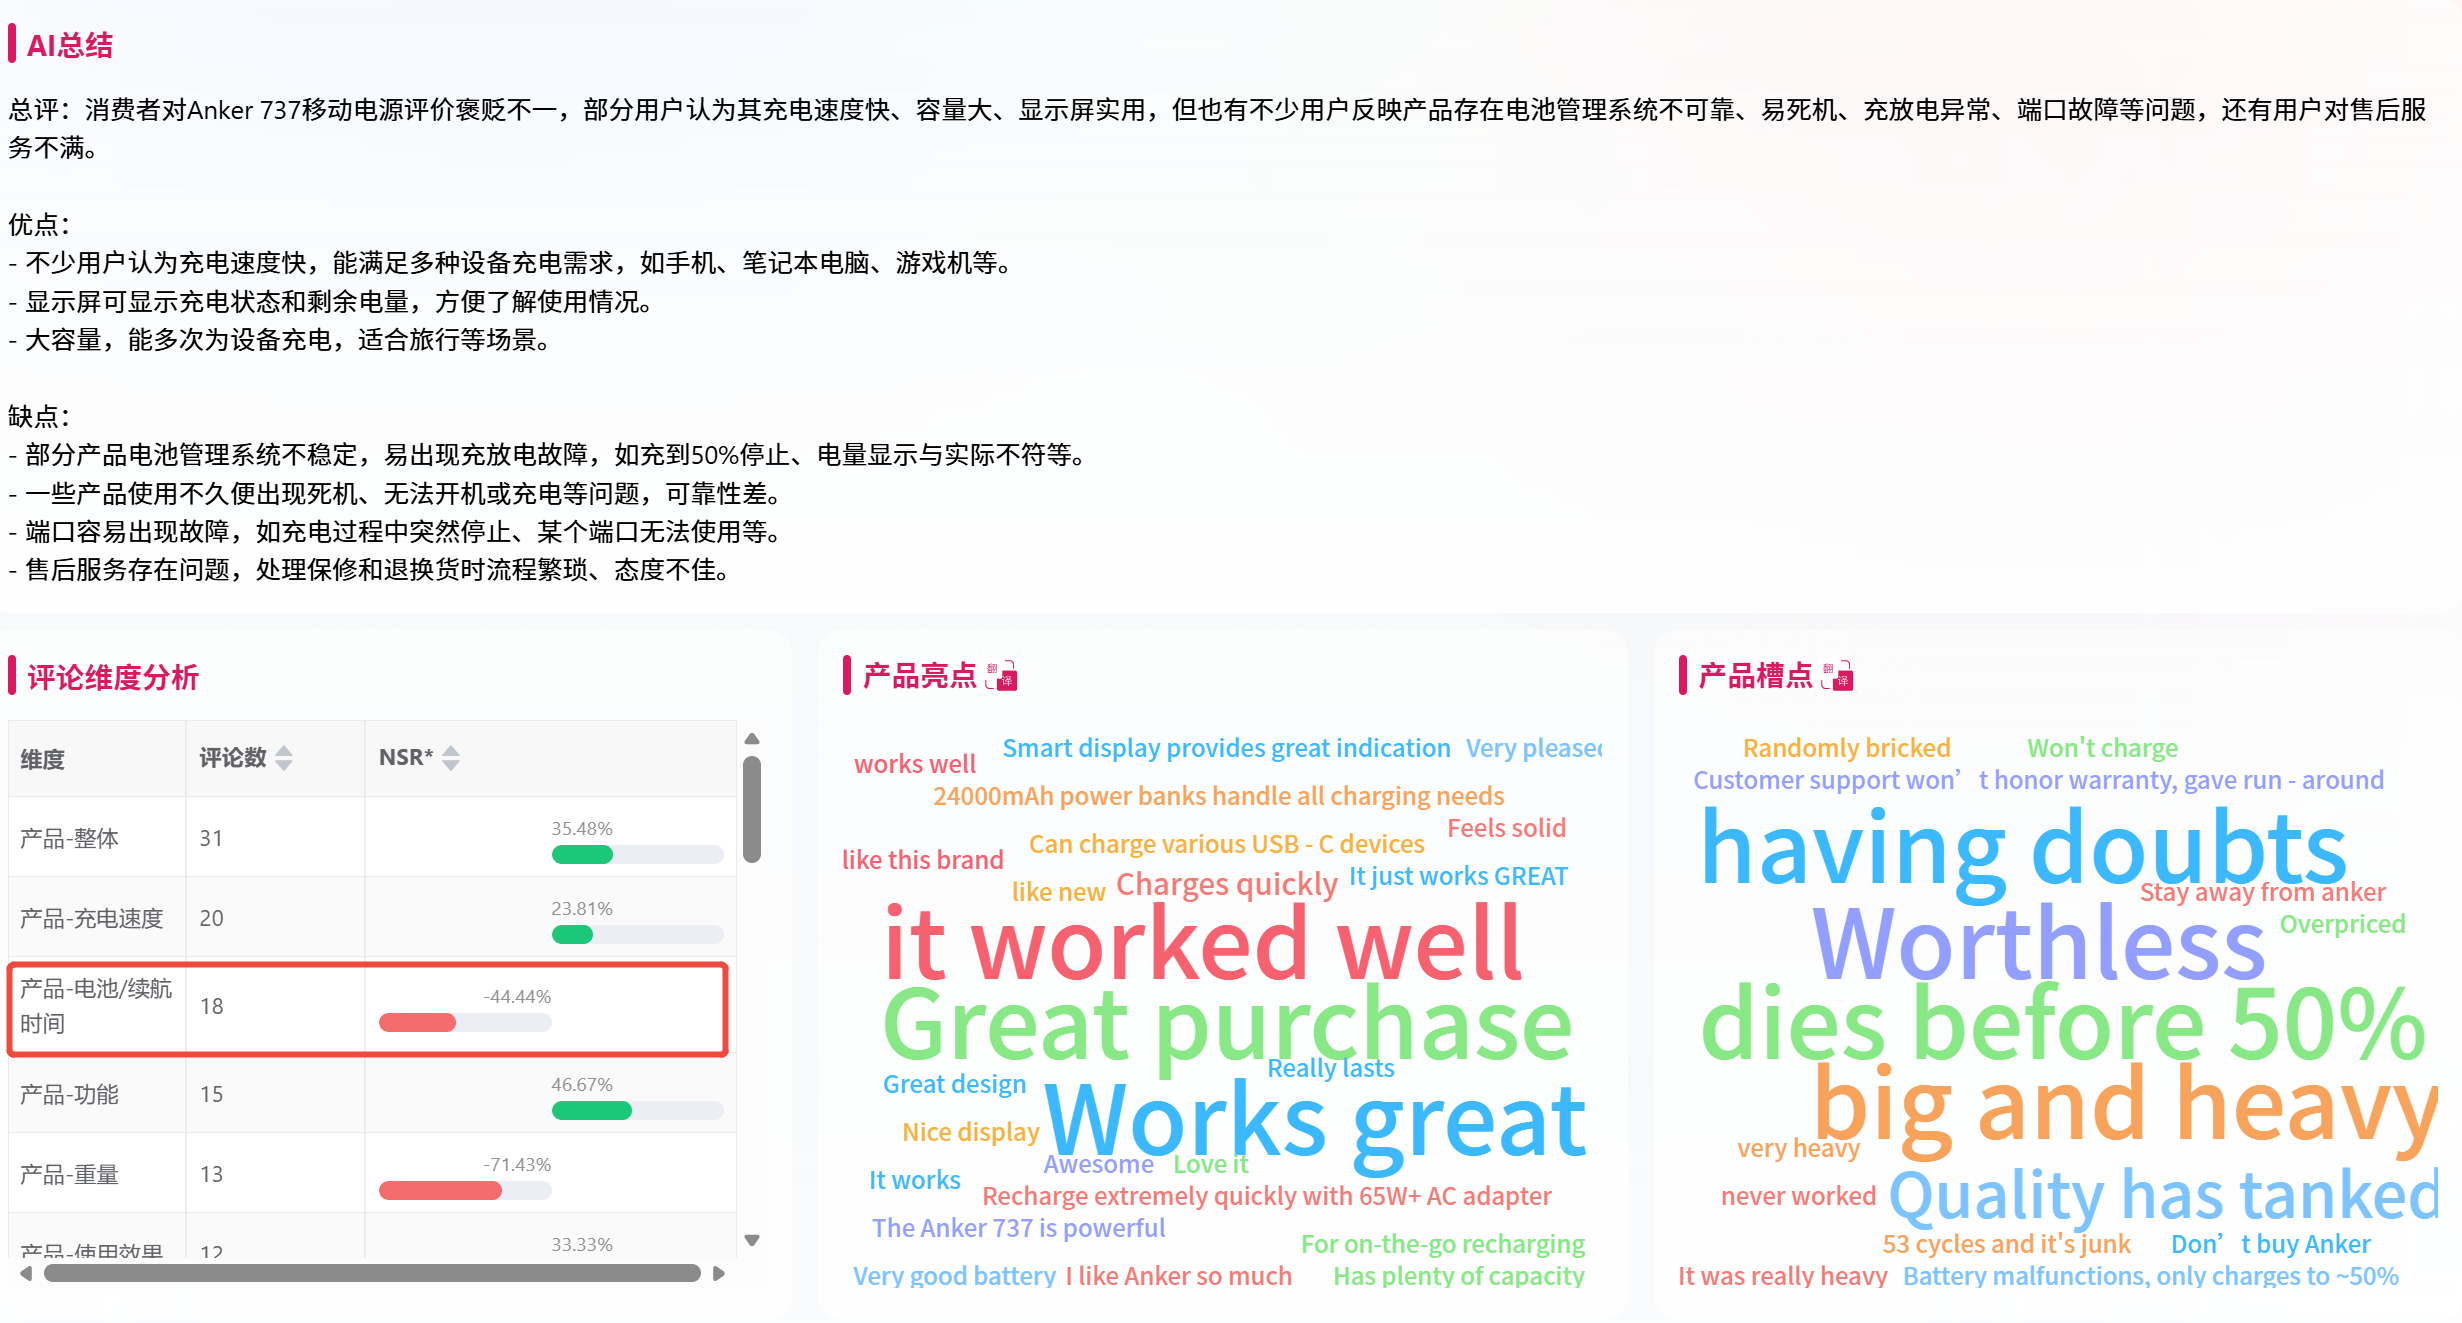
- Review analytics in the Product Analysis module show that 64% of negative reviews point to poor battery life.
- Optimization path: increase battery capacity at an added cost of $0.8 and raise the price to $14.99.
3) Quick TikTok Product Potential Scorecard
| Dimension | Indicator | Score (1-5) | Data Source |
|---|---|---|---|
| Heat authenticity | Creator audience fit | ▢▢▢▢▢ | Nuozhou creator profile |
| Interaction health (like/comment ratio) | ▢▢▢▢▢ | Nuozhou video analytics | |
| Consistency of content output | ▢▢▢▢▢ | Nuozhou posting-frequency report | |
| Commercial conversion | Marketplace monthly sales | ▢▢▢▢▢ | Nuozhou cross-platform sales data |
| Search keyword overlap | ▢▢▢▢▢ | Nuozhou keyword comparison | |
| Number of competing sellers | ▢▢▢▢▢ | Nuozhou competitor monitoring | |
| Profit headroom | TikTok vs. marketplace price gap | ▢▢▢▢▢ | Nuozhou cross-platform pricing |
| Estimated gross margin | ▢▢▢▢▢ | 1688 cost + logistics model | |
| Number of improvable negative-review issues | ▢▢▢▢▢ | Nuozhou product analytics | |
| Total score | 20 or above = viable to enter |
Recommended tool: Nuozhou Cross-Border Analytics TikTok Product Evaluation Template.
4) Why Nuozhou Cross-Border Analytics Is the Right Validation Tool
Data Advantage
- It combines TikTok creator data such as audience profile and video performance with marketplace sales and pricing data from Amazon, Shopee, and more.
- Its social-to-commerce comparison layer lets you directly compare TikTok hot terms with marketplace demand signals.
Compliance Support
- Creator data supports verification requirements under advertising regulations.
- Pricing data is managed under compliant data standards.