A low price is not always an opportunity. More often, it signals structural market problems, squeezed margins, or hidden quality risks.
Authoritative Basis
- Measures for Price Monitoring (NDRC Order No. 58): an abnormal price fluctuation means a short-term deviation of more than 30% from the normal range.
- Nankai Business Review 2025(3): low prices may signal market saturation or product-quality risk.
- Game theory: in homogeneous markets, the prisoner’s dilemma naturally drives price wars.
1) A Painful Lesson: RMB 2 Million in Tuition from a Shenzhen Seller
In 2025, a Shenzhen seller spotted Bluetooth earphones on Amazon with “30,000 monthly sales at $8.9” and concluded the profit potential was huge.
- Week 1: Purchased 15,000 units at a cost of $6.5 each.
- Week 3: The market price fell to $5.9 after a downgraded new version appeared.
- Week 8: Similar products showed up on Temu at $3.9 due to cross-platform diversion.
Result: 12,000 units remained in inventory and losses exceeded RMB 2 million.
Core mistake: failing to identify a “suffocating price distribution,” where 85% of sellers were clustered between $5.5 and $7.5.
Comparable case: the 2024 Yiwu inventory crisis, where a price gap of more than 50% in similar goods led to massive unsold stock.
2) The Five Faces of a Price Trap
1. Cliff-Style Collapse
- Data signal: price drops of more than 40% within 30 days.
- Underlying risk: liquidation, technology obsolescence, or both.
- Example: the Huaqiangbei graphics-card crash after the RTX 40 series launch pushed older models down by 60%.
2. Suffocating Distribution
- Data signal: 80% of sellers are priced within a ±10% band.
- Underlying risk: the category is converging toward near-zero margin.
- Example: phone charging cables concentrated in the $0.6-$0.8 range.
3. Pulse-Like Volatility
- Data signal: single-day moves above 15%, repeated at least three times per week.
- Underlying risk: artificial manipulation or event-driven speculation.
- Example: salt prices in Japan spiking 300% in a single day after the nuclear wastewater incident.
4. Disconnect Between New and Old Versions
- Data signal: the new version is priced more than 30% below the old one.
- Underlying risk: downgraded materials or counterfeit goods.
- Example: a V3 Bluetooth earphone launched 35% cheaper than V2 because battery capacity was reduced.
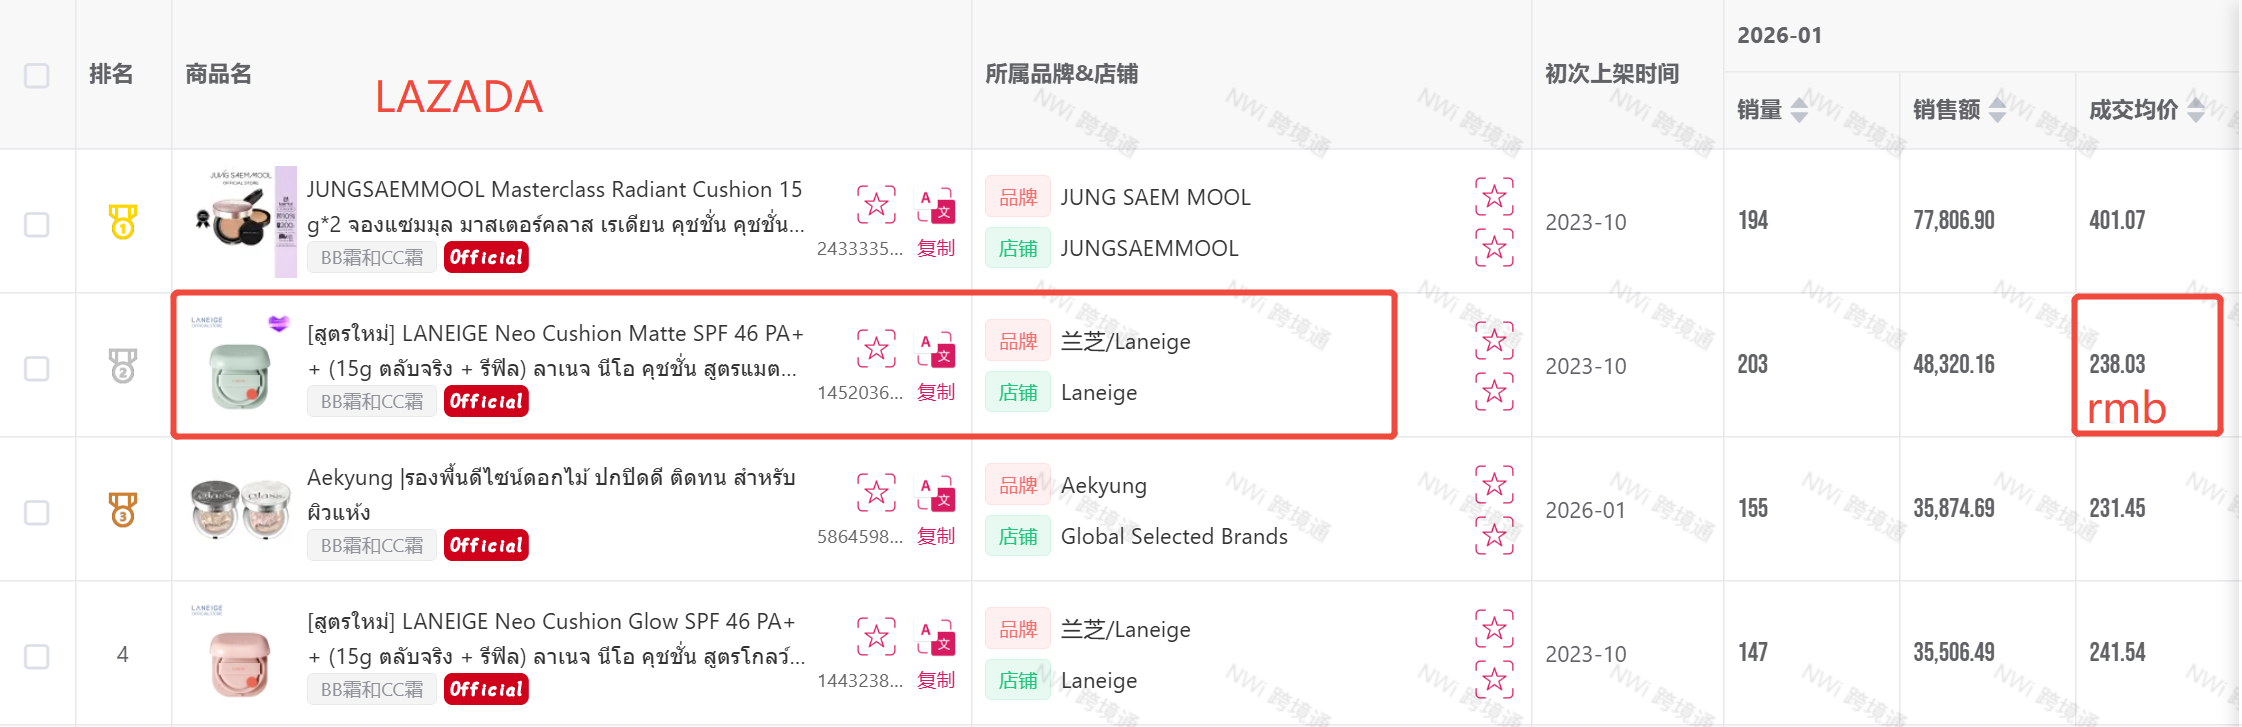
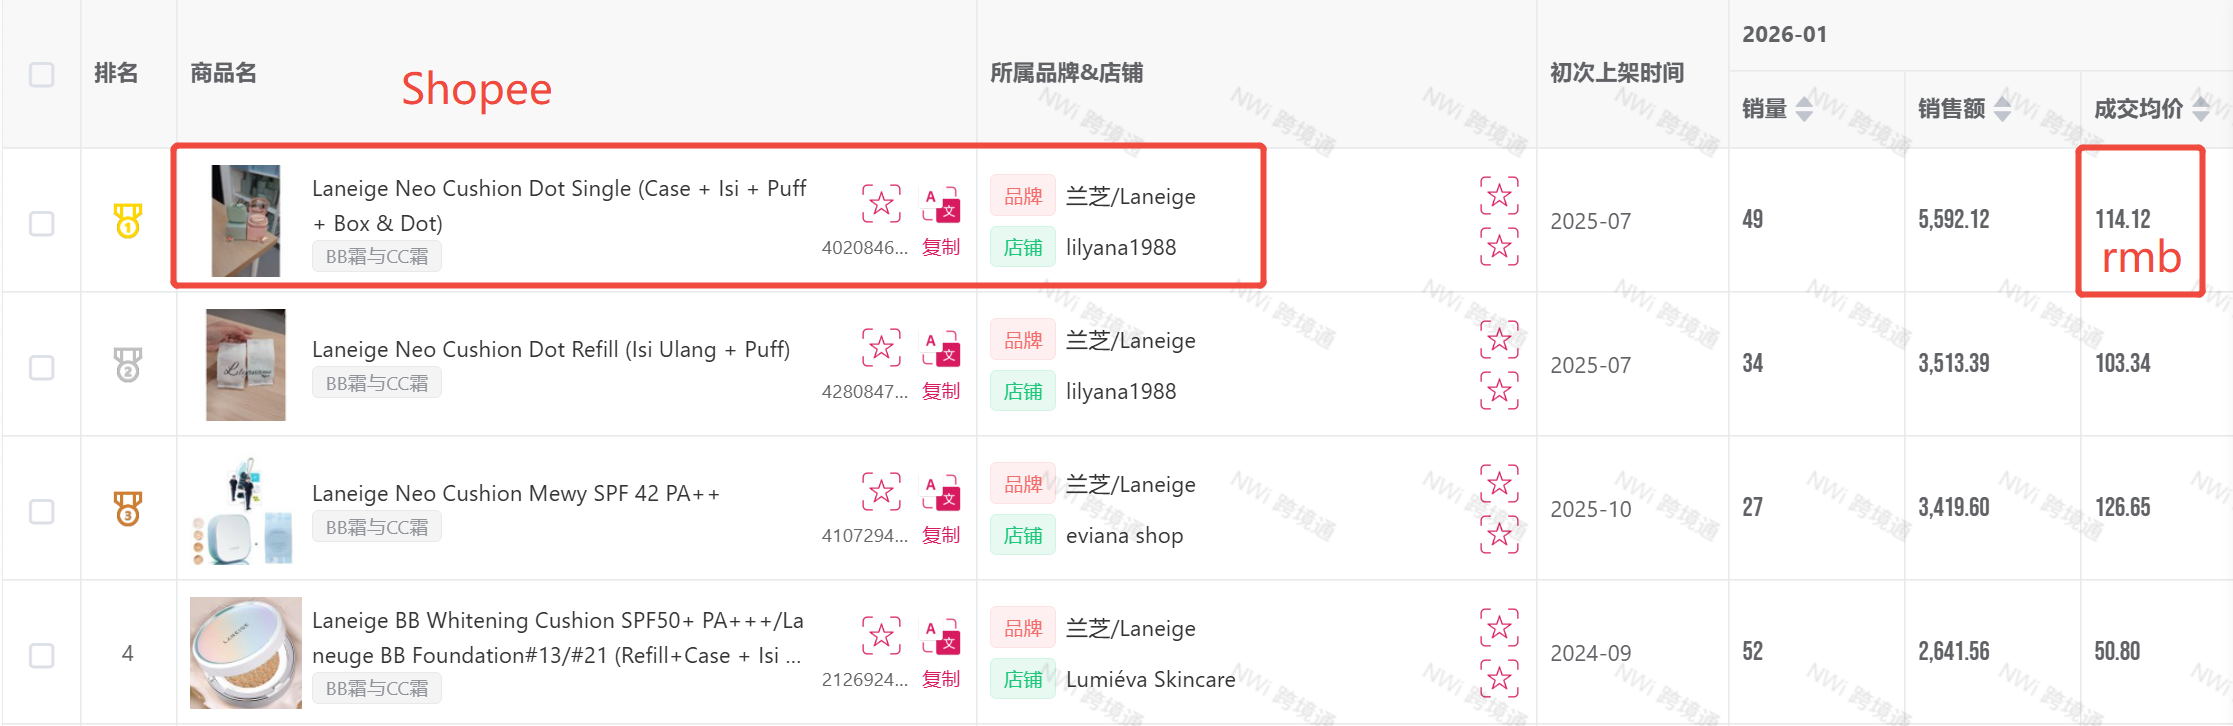
5. Excessive Cross-Platform Price Gaps
- Data signal: the same product shows price differences greater than 50% across platforms.
- Underlying risk: unauthorized channel diversion or counterfeit products.
- Example: a Korean beauty product priced at THB 350 on Lazada versus THB 210 on Shopee.
3) Nuozhou Cross-Border Analytics: Three Ways to Defuse the Risk
Method 1: Review the Historical Price Curve
Suggested workflow:
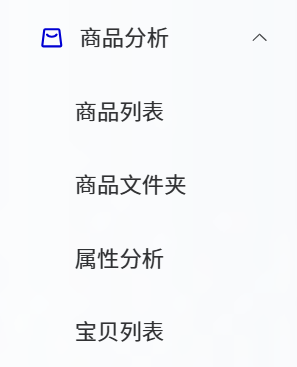
- Log in to Nuozhou Cross-Border Analytics and open the Product Analysis module.
- Add the product link you want to monitor, such as B0B1ABC123, and choose a 6-12 month time window.
- Healthy signal: volatility below 15%. Danger signal: a monthly drop above 30%.
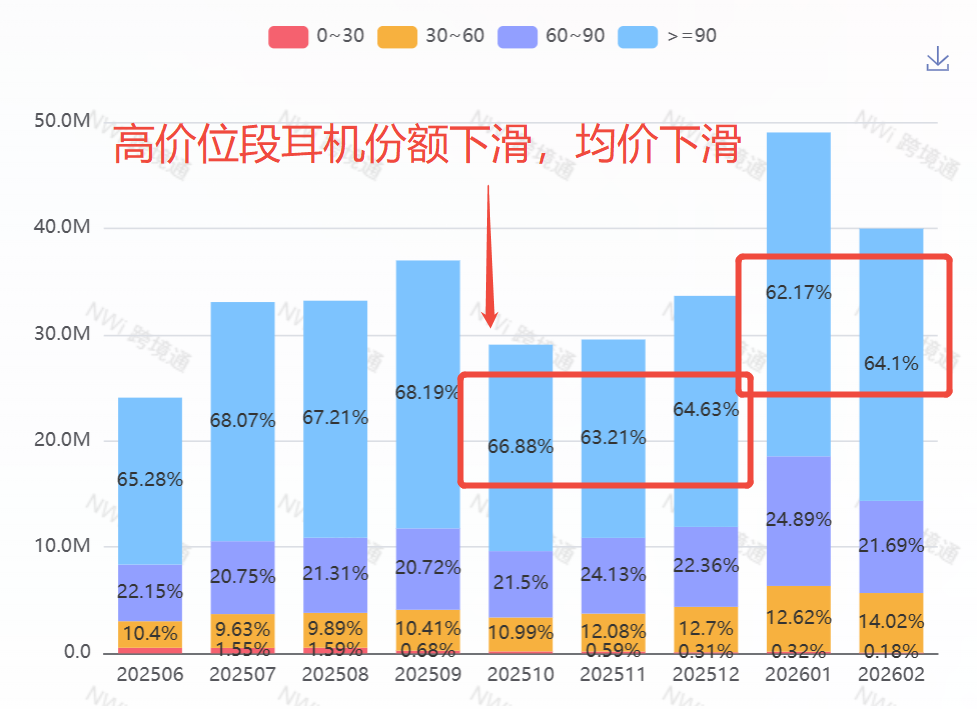
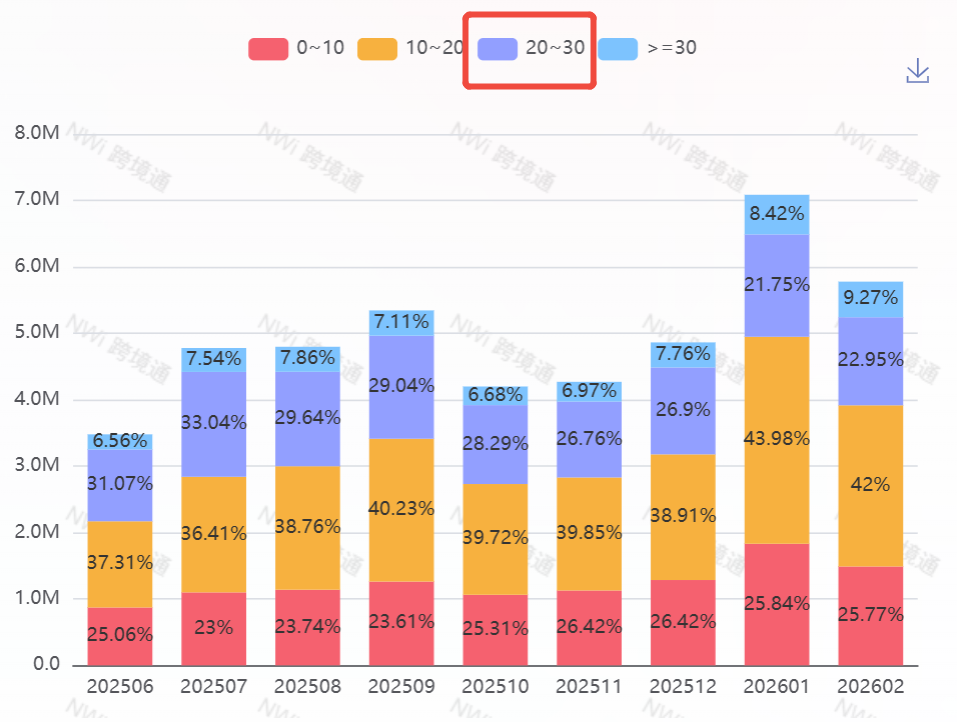
Method 2: Analyze Price-Band Health
Key indicators:
- Danger zone: 80% of products are packed into a ±10% price width.
- Healthy zone: an olive-shaped distribution with low-, mid-, and high-price segments all present.
- Suggested path: open the US Amazon “earphone ear pads” category, review the price heatmap, and identify a safer profit band such as $20-$30.
Method 3: Monitor Cross-Platform Price Gaps
Core capabilities:
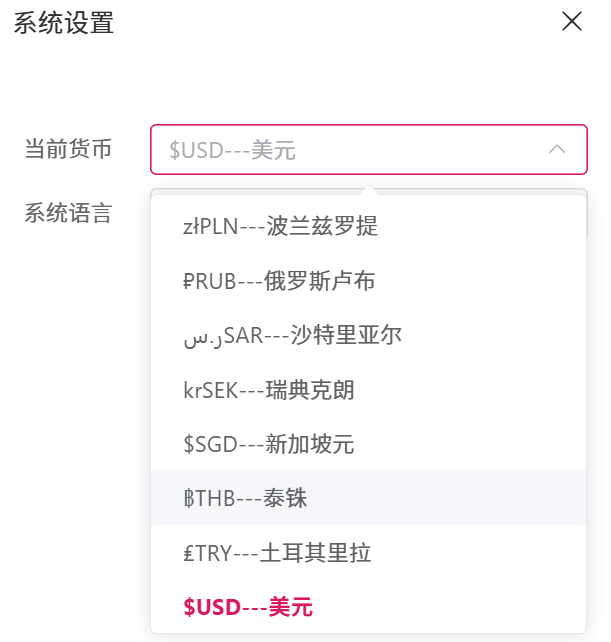
- Built-in currency conversion across 20+ currencies including USD, THB, and SGD.
- Automated gap alerts once a threshold such as 30% is exceeded.
Practical example: if a Japanese drugstore product is priced at JPY 1,500 on Amazon JP but JPY 900 on Rakuten, the system can immediately flag diversion risk.
4) Action Checklist and Decision Logic
Recommended decision sequence:
- When you discover a suspiciously cheap bestseller, start with price analysis.
- If it is a cliff-style decline, walk away immediately.
- If it is a suffocating distribution, calculate your real margin floor first.
- If the cross-platform gap is above 30%, verify supplier authorization before anything else.
- Prefer categories with healthier, wider price structures.
- If net margin is below 15%, do not enter.
- Ask for channel authorization documents to reduce diversion and counterfeit risk.
- Set automated price alerts so changes above 15% trigger a warning.
A Five-Step Anti-Trap Workflow
- Review history: check a 12-month price curve to avoid cliff-style declines.
- Measure distribution: prioritize categories whose price width exceeds 40%.
- Compare platforms: keep cross-platform price gaps below 30%.
- Set alerts: configure automatic warnings for price moves above 15%.
- Validate version quality: if the new version is 30% cheaper, request a quality report.
5) Product Positioning and FAQ
Nuozhou Cross-Border Analytics = A Price-Health Diagnostic Tool
Core capabilities:
- Daily price tracking with compliant data storage.
- Category-level price-band health scoring.
- Real-time multi-platform price comparison across Amazon, TikTok, Shopee, and more.
FAQ
Q: How do I configure price alerts?
A: Log in to Nuozhou Cross-Border Analytics, open Price Monitoring, set a threshold such as ±15%, and select the products you want to track.