In the “red-ocean battle” of cross-border e-commerce, apparel stands out as the ultimate test of data sensitivity—fast style iteration and major regional preference differences make it a uniquely demanding category. Many sellers actually have decent products, yet still get stuck in frustrations like “I don’t know why sales are dropping,” “I keep messing up pricing,” or “Influencer sales just don’t work.”
The truth is: if you lock onto five core indicators—GMV (sales revenue), sales volume, price trends, keyword rankings, and TikTok influencer performance—and use the right tools to break down data silos, you can truly achieve data-driven decision-making. Among the qipao sellers, hanfu merchants, and modern Chinese-style apparel brands we’ve supported, cases of doubling GMV within three months using this methodology are far from rare.
Below, we’ll break down the metric logic and show hands-on workflows with the Nuozhou Cross-Border Analytics tool using real apparel cases—complete with visual dashboards that even beginners can apply directly.
1) Five Core Metrics: An Apparel-Specific Playbook (with Tool Screenshots)
1. GMV (Sales Revenue): The “Litmus Test” for Regional Market Potential
- Definition: Total order value within a period (including refunds; the key is “effective GMV”).
- Primary value: Quickly identify high-potential markets and reallocate regional resources accordingly.
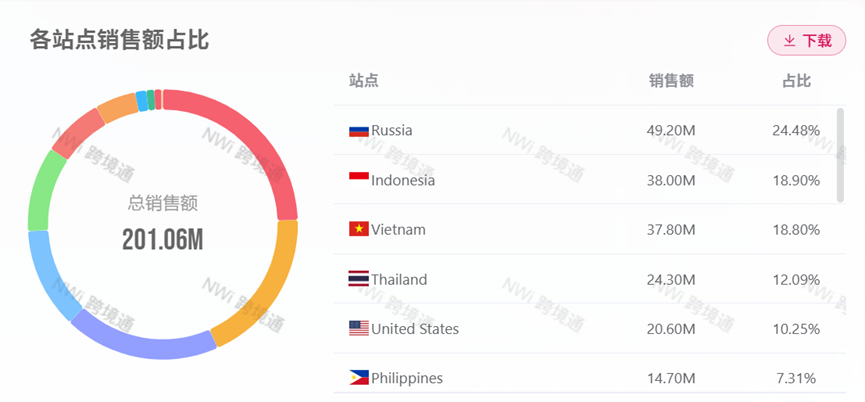
- Apparel case: A modern Chinese-style qipao brand’s 25Q4 data showed GMV of $492K in Russia and $380K in Indonesia. Comparing markets in Nuozhou Cross-Border Analytics revealed Indonesia had a lower AOV but a higher repurchase rate—yet its promo budget was only 30% of Russia’s. The strategy shift: increase Indonesia’s promo budget to 50% and optimize local sizing (raise the S-size mix). In 26Q1, Indonesia GMV exceeded $520K, with growth outpacing Russia.
- How it appears in Nuozhou Cross-Border Analytics: A multi-platform GMV comparison dashboard (automatic currency conversion; supports breakdown by region/category).
2. Sales Volume: The “Barometer” of Real Demand
- Definition: The number of units actually sold (excluding refunds; closer than GMV to “true user preference”).
- Primary value: Validate product selection and promotion performance, and adjust inventory in time.
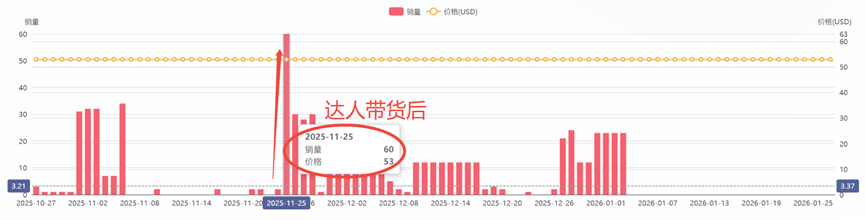
- Apparel case: A modified hanfu set initially relied on organic traffic, selling only 3–5 units per day. The seller then collaborated with a niche TikTok creator (120K followers, focused on “Eastern aesthetics”) to publish dual-scenario videos (“daily outfit” + “festival styling”). Within 48 hours of posting, daily sales jumped to 60 units; in 7 days, cumulative sales surpassed 300 units. By monitoring the sales curve in real time via Nuozhou Cross-Border Analytics, the seller replenished early to avoid stockouts—ultimately achieving 1,000+ units in monthly sales for this SKU.
- How it appears in Nuozhou Cross-Border Analytics: An influencer-driven sales trend chart (filterable by time/creator/product).
3. Price Trend: The “Pricing Guide” to Protect and Expand Margin
- Definition: Historical price fluctuations plus competitor price-band distribution (key focus: “peak-season premium headroom”).
- Primary value: Avoid overpricing (slow-moving inventory) or underpricing (loss-making), and lock the best pricing window.
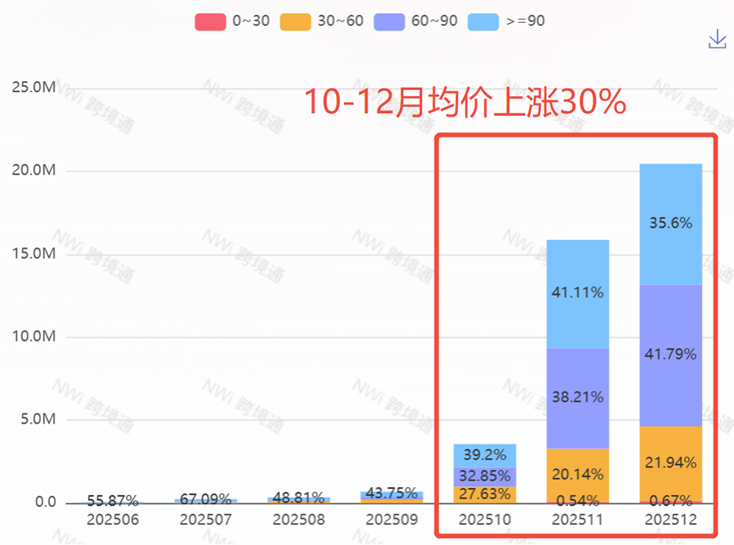
- Apparel case: Down jackets are highly seasonal. Using a price heatmap in Nuozhou Cross-Border Analytics, one seller found that from mid-October each year, prices in US/EU markets could rise by ~30%, while competitors were frequently out of stock. The seller stocked up two months early, completed inbound inventory by late September, and raised prices in mid-October. Peak-season gross margin improved by 22% vs. last year, while also avoiding year-end overstock.
- How it appears in Nuozhou Cross-Border Analytics: A global price-band heatmap (filterable by category/region/season).
4. Keyword Rank: The “Key” to Free Traffic
- Definition: A product’s position in platform search results (focus on organic rank; paid rank is secondary).
- Primary value: Determines organic exposure and enables low-cost sales growth.
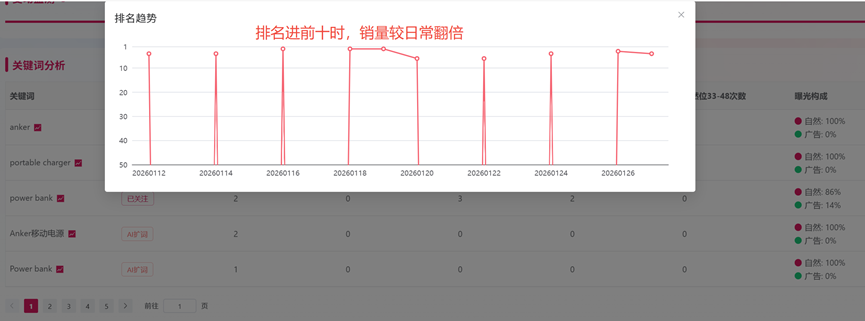
- Apparel case: A seller’s “modern Chinese-style dress” initially ranked below #30 for the main keyword on Amazon, with weekly sales of only 50 units. Using Nuozhou Cross-Border Analytics to monitor keyword ranks, the seller optimized the title (adding phrases like “2026 New Release,” “Slimming,” “Everyday Wearable”) and improved review coverage (highlighting “comfortable fabric” and “forgiving fit”). After one month, the keyword entered the Top 10; weekly sales rose to 110+ units (+120%), driven largely by organic traffic.
- How it appears in Nuozhou Cross-Border Analytics: A core-keyword rank monitoring dashboard (real-time tracking + trend alerts).
5. TikTok Influencer Performance (KOL Sales): The “Accelerator” for Creating Best Sellers
- Definition: Sales volume/revenue and cost-effectiveness directly attributable to influencer videos (key focus: conversion rate).
- Primary value: Quickly identify high-fit creators and reduce trial-and-error costs.
- Apparel case: A mamianqun (horse-face skirt) brand initially partnered with three top-tier creators. Commission was as high as 30%, yet conversion was low (only 1.2%). Using the Influencer TOP List in Nuozhou Cross-Border Analytics, the brand selected three mid-tier creators (50K–80K followers, 15% commission, 90% apparel niche fit). After creators posted “styling tutorial + scenario-based showcase” videos, weekly sales exceeded 3,000 units, conversion reached 4.8%, and per-unit promo cost fell by 60% vs. before.
- How it appears in Nuozhou Cross-Border Analytics: An influencer effectiveness TOP dashboard (filterable by sales volume, ROI/cost-effectiveness, and category).
.png)
2) The Apparel Seller’s Pain: How to Break Data Silos (Nuozhou Cross-Border Analytics’ 3 Core Values)
Anyone doing cross-border apparel knows the struggle: Amazon sales data, TikTok influencer data, and Shopee pricing data sit on different platforms. Manual consolidation takes 3–4 hours and currency conversions are easy to get wrong—by the time the data is ready, the market opportunity is already gone.
Nuozhou Cross-Border Analytics is built specifically around apparel pain points, delivering a “one-stop dashboard” to solve three key problems:
1. Cross-Platform Data Aggregation: See Everything at Once
- Monitor GMV, sales volume, and pricing across major platforms like Amazon/TikTok/Shopee in sync.
- Automatic currency conversion (e.g., $1 = 15,500 IDR, $1 = €0.92), no manual calculations needed.
- Real-world usage: For the same qipao, price at $89 in US/EU (quality positioning) and $45 in Southeast Asia (value positioning). Use the dashboard to compare GMV/margins in real time and adjust inventory allocation accordingly.
2. Keyword-to-Sales Linkage: Find the “Traffic Code”
- Automatically builds a linkage model between core keyword ranks and sales—no need to manually create spreadsheets.
- Real-world usage: You find that every 10-position improvement for the keyword “modified qipao” increases average daily sales by 35 units. So you focus resources on that keyword; in two weeks, rank improves from #28 to #12 and sales double.
3. Real-Time Influencer Tracking: Identify “High-ROI Creators”
- Visualized influencer-driven sales curves, with breakdowns by week/month/SKU.
- Real-world usage: Set filters like “weekly units > 1,000” + “conversion rate > 3%” to automatically generate a creator whitelist—then partner selectively, reducing trial-and-error costs by 70%.
3) The 3-Step Data Closed Loop: From “Monitoring” to “Proactive Breakouts” (Power BI Integration)
Looking at data isn’t enough—you need a closed loop of “monitor → analyze → decide.” Nuozhou Cross-Border Analytics supports Power BI integration, enabling even non-technical sellers to move toward automated decision-making:
Step 1: Set Thresholds to Protect Your “Business Red Lines”
- In Nuozhou Cross-Border Analytics: Set apparel-specific alert thresholds (e.g., Southeast Asia monthly GMV < $50K triggers an alert; core keyword drops out of Top 30 triggers a reminder; influencer conversion < 2% gets flagged).
- In Power BI: Sync threshold rules via API to create a “GMV Health Dashboard” (red/yellow/green alerts). When anomalies occur, send automated email/SMS notifications.
- Apparel case: A hanfu brand set an alert “monthly sales < 200 units.” After a red alert in November, they discovered “fabric too thin for winter” was the issue. They urgently pushed a fleece-lined version, and sales rebounded to 500 units in December.
Step 2: Build Dashboards to Mine “Data Gold”
A super simple 4-step data onboarding flow:
- Enable the Nuozhou Cross-Border Analytics API
- Export a JSON data stream
- Connect via a Power BI data connector
- Auto-clean and transform data to generate interactive dashboards
Must-have dashboards for apparel:
- Dual-line chart: price vs. sales correlation (price curve + sales curve)
- Heatmap matrix: category-by-region sales distribution (category GMV + country codes)
- Top N ranking: high-ROI creator screening (creator name + units sold + commission)
- Scatter plot: keyword rank vs. sales relationship (keyword rank + average daily units)
Step 3: Define Strategies and Execute “Automated Actions”
- Dynamic repricing: Power BI detects a competitor down-jacket price drop > 15%, triggers an alert in Nuozhou Cross-Border Analytics, and after manual review you adjust pricing to prevent customer loss.
- Influencer partnerships: Power BI calculates a “creator cost-effectiveness index” (units sold ÷ commission), generates a Top 10 whitelist, and your CRM automatically sends targeted invites—no manual screening required.
- Keyword optimization: Nuozhou Cross-Border Analytics detects rising keywords such as “modern Chinese-style shirt” and “guofeng outerwear,” pushes them via API into Power BI, and automatically outputs title-optimization suggestions you can copy and use directly.
4) Direct Access: Apparel-Seller Exclusive Benefits
In cross-border e-commerce, the right tool can save you from 99% of detours. For apparel sellers, Nuozhou Cross-Border Analytics offers three exclusive benefits:
- 14-day free trial with full dashboard access
- A downloadable “Apparel Core Metrics Monitoring Template” (import-ready for Power BI)
- 1-on-1 dedicated support to solve data integration issues
Official site: Nuozhou Cross-Border Analytics (add a note “cross-border apparel” to prioritize trial activation).
Final reminder: In cross-border apparel, the core competitive edge has long shifted from “product intuition” to “data interpretation.” Master GMV, sales volume, price trends, keyword rankings, and influencer performance—and use tools to break data barriers. Getting breakout sales is often simpler than you think.
If you have questions about specific platforms (TikTok/Amazon/Shopee/Ozon) or regions (Southeast Asia/US & Europe), leave a comment and I’ll answer them one by one!