A top keyword ranking means visibility, not necessarily conversion, profitability, or a worthwhile ad budget.
Conceptual Anchors
- Signal-versus-noise theory in information economics: rankings are surface-level signals and may include substantial irrelevant traffic, such as brand-term interception.
- Search-intent classification in SEO: informational searches and transactional searches should never be treated as the same thing.
1) Common Misread: What High Rankings Can Hide
Case 1: The Illusion of a Big-Brand Keyword
- Scenario: an earphone seller wins the No. 3 position for the keyword “Sony headphones.”
- Result: more than 200 clicks per day, but a conversion rate of only 0.2%, far below the category average of 5%.
- Root cause: most traffic is captured by Sony’s official site and flagship stores, while ordinary sellers become traffic handoff pages.
Case 2: Informational Long-Tail Terms That Do Not Convert
- Scenario: the keyword “how to maintain a phone battery” ranks No. 1 on page one.
- Result: monthly search volume reaches 20,000, but related product sales are close to zero.
- Root cause: the query is informational, not purchase-driven.
- Core mistake: equating visibility with commercial value.
2) A Three-Dimensional Model for Real Keyword Value
| Dimension | Key Question | How to Verify It |
|---|---|---|
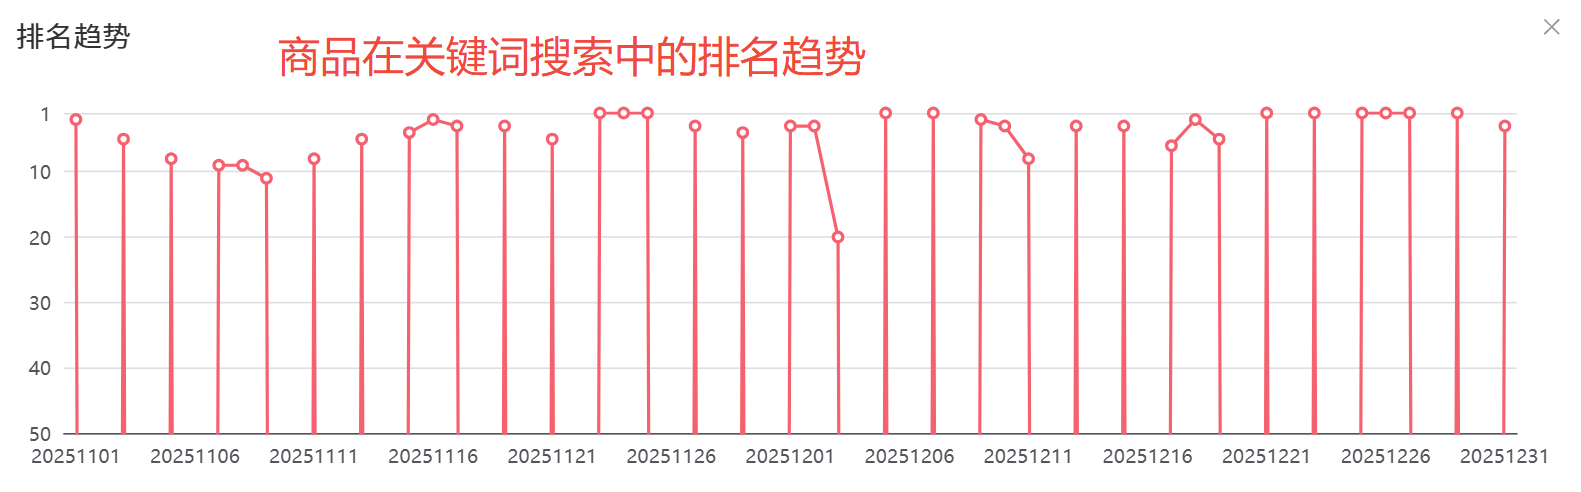
| 1. Ranking dimension | Is the keyword on page one? How stable is the position? | Review the historical ranking trend curve |
| 2. Traffic dimension | Is search volume sustainable? | Compare 30-day and 90-day search trends |
| 3. Commercial dimension | Does the keyword produce real sales value? | Use keyword-to-product GMV analysis |
| - Total sales and price bands of the TOP10 products under the keyword | ||
| - Traffic concentration, such as whether TOP3 products take more than 70% of GMV |
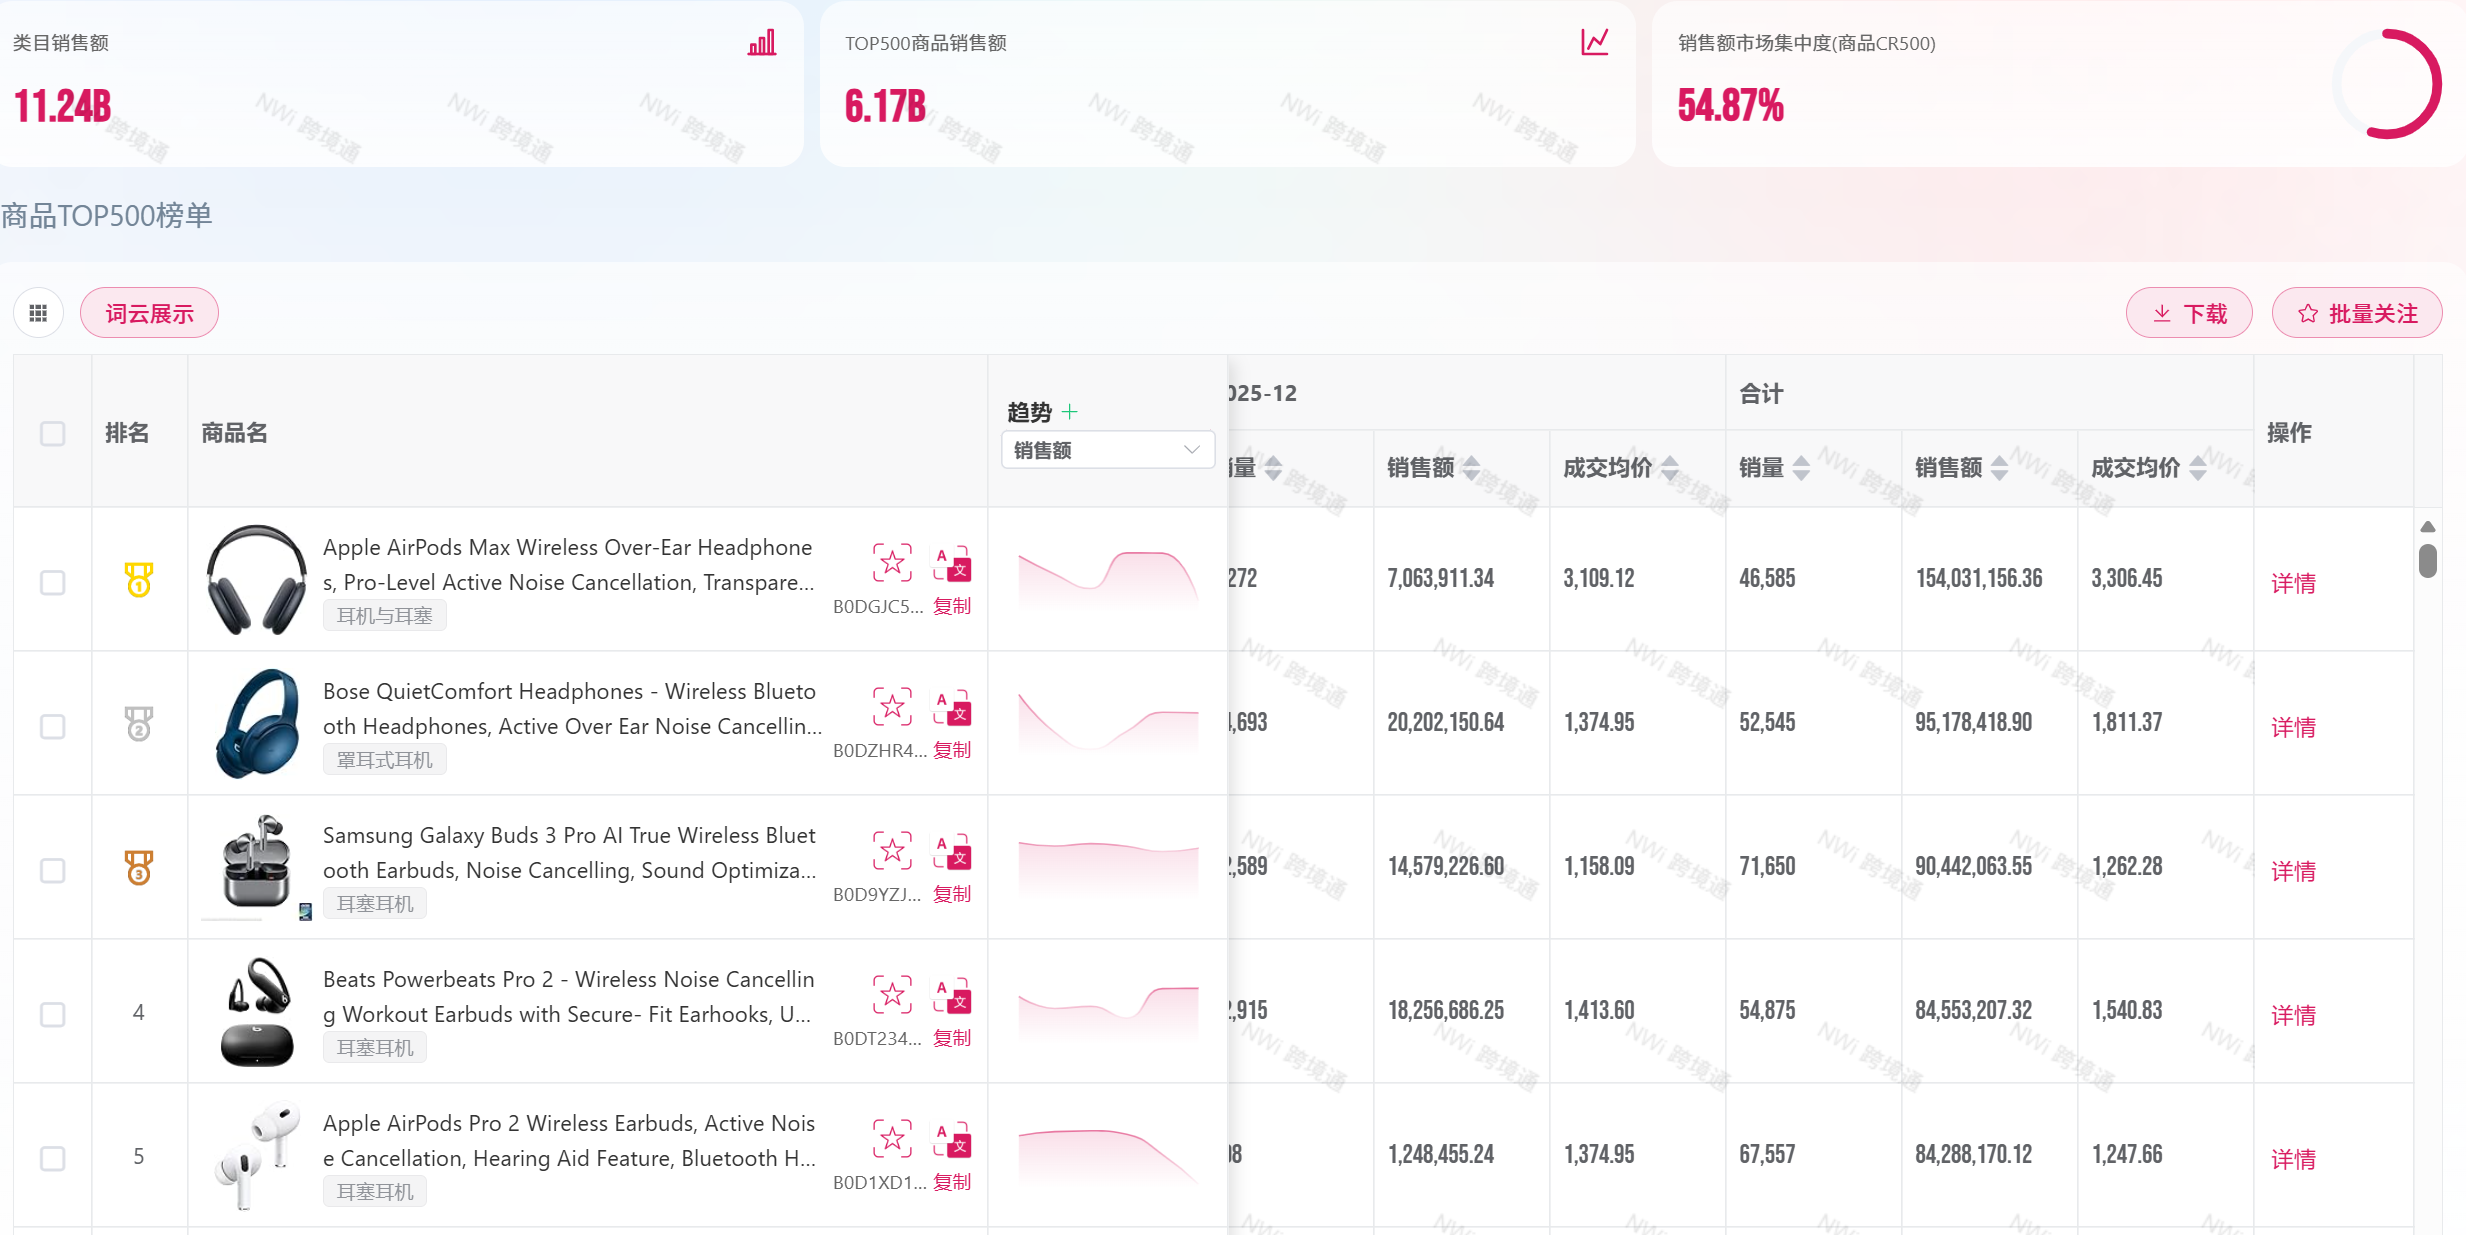
For a keyword such as “Bluetooth earphones,” at least three signals must be reviewed together:
Concentration of Related Products
- Head-dominated pattern: TOP3 products take 85% of GMV, which leaves very little room for new sellers.
- Dispersed opportunity pattern: TOP10 products each hold less than 10% of GMV, suggesting room to enter.
Price-to-Sales Relationship
| Price Band | Number of Products | Share of Total Sales | Conclusion |
|---|---|---|---|
| $10-$20 | 120 | 62% | Red-ocean segment with heavy price competition |
| $50-$80 | 18 | 9% | Higher-margin segment with stronger premium potential |
Seasonality
- Education-use headsets can see sales spikes of 300% during testing seasons.
- Historical data is necessary to avoid mistaking seasonal ranking strength for year-round demand.
Nuozhou’s key advantage here is that it connects keyword data directly to product-level GMV, which is where commercial truth becomes visible.
3) Practical Keyword Value Scorecard
Score any keyword across three dimensions, with 5 points per item:
| Evaluation Item | Scoring Rule | Sample Score for “sports earphones” |
|---|---|---|
| Ranking stability | Less than 5 positions of fluctuation in 30 days = 5 points; more than 20 = 1 point | 4 points (8-position fluctuation) |
| Sustainability of search trend | Steady 90-day upward curve = 5 points; sharp rise and drop = 2 points | 3 points (30% decline after the holiday period) |
| Commercial penetration power | ||
| - Head-concentration coefficient | TOP3 GMV share below 30% = 5 points; above 70% = 1 point | 2 points (TOP3 = 82%) |
| - Share of high-margin products | GMV share of products above $50 greater than 20% = 4 points | 3 points (15%) |
| Total score | 12 out of 20; treat anything below 10 with caution |
4) Cognitive Upgrade: One-Dimensional Thinking vs. Cross-Dimensional Analysis
| Evaluation Method | Conclusion for the Keyword “waterproof phone pouch” | Decision Risk |
|---|---|---|
| Ranking-only view | No. 2 ranking, mistakenly judged as a “high-quality keyword” | Actual loss: average selling price of only $1.2 and a 25% after-sales issue rate |
| Cross-dimensional view using Nuozhou data | ||
| - Commercial dimension | TOP10 product GMV is below $5K and after-sales issue rate is above 20% | Exit early and pivot to “diving phone case” instead |
| - Traffic dimension | Summer peak accounts for 80% of annual search volume | Strong seasonality must be identified before spending budget |