Home / Products / Industry Analysis
Product Introduction

Industry Analysis

End-to-end category intelligence for cross-border decisions

Built around seven layers: market size, top brands, top stores, top products, subcategory structure, custom market, and attribute analysis. Keep teams aligned under one data language.

Industry analysis hero visual
I
A
01 / Market Size

Read volume, structure, and trend in one place

Quickly assess category volume, sales value, store scale, and structural composition, then combine trend curves to build a consistent view of market momentum.

Market size overview
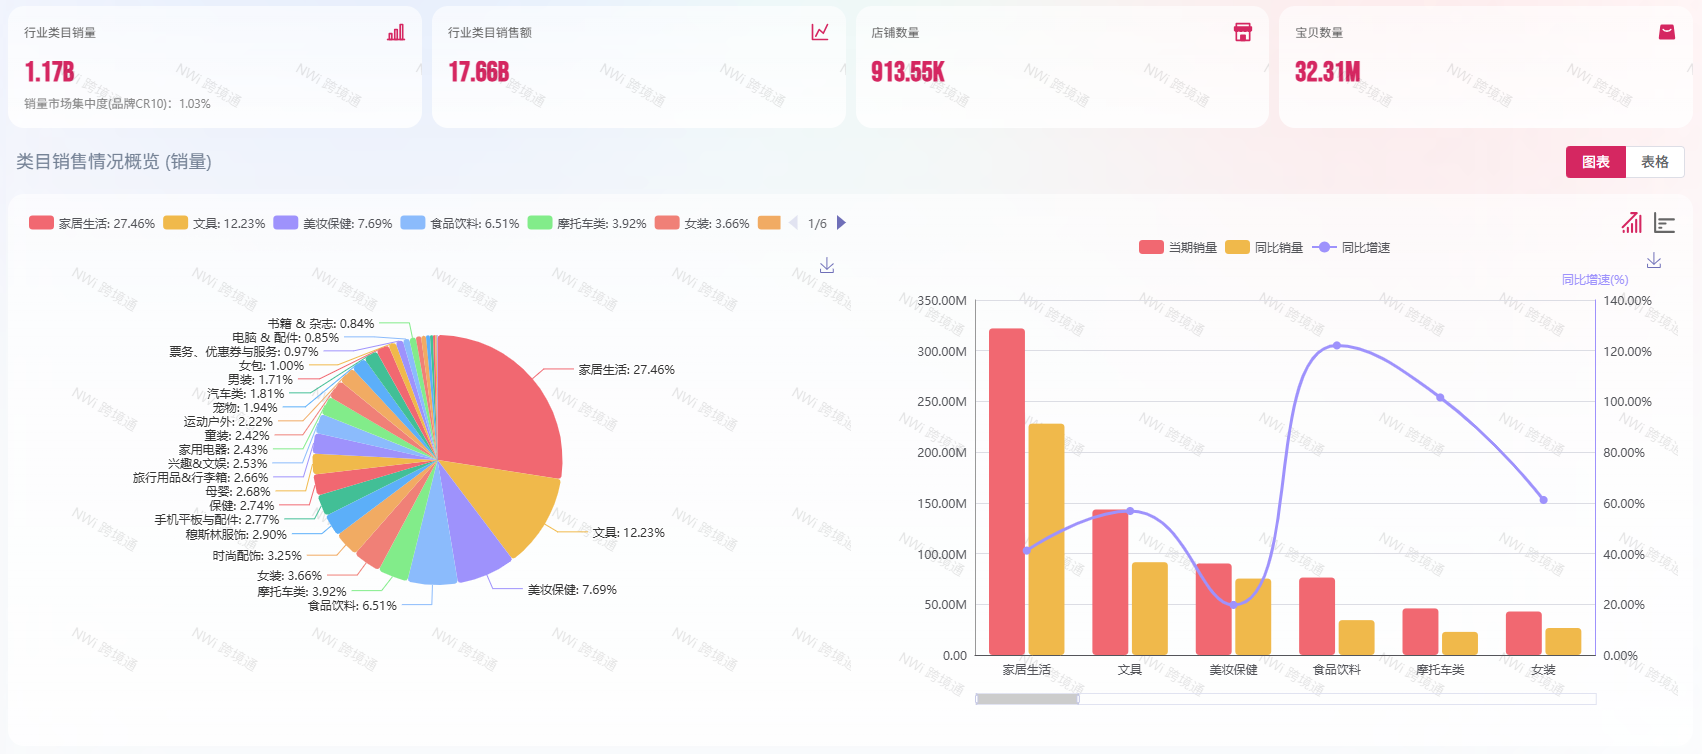
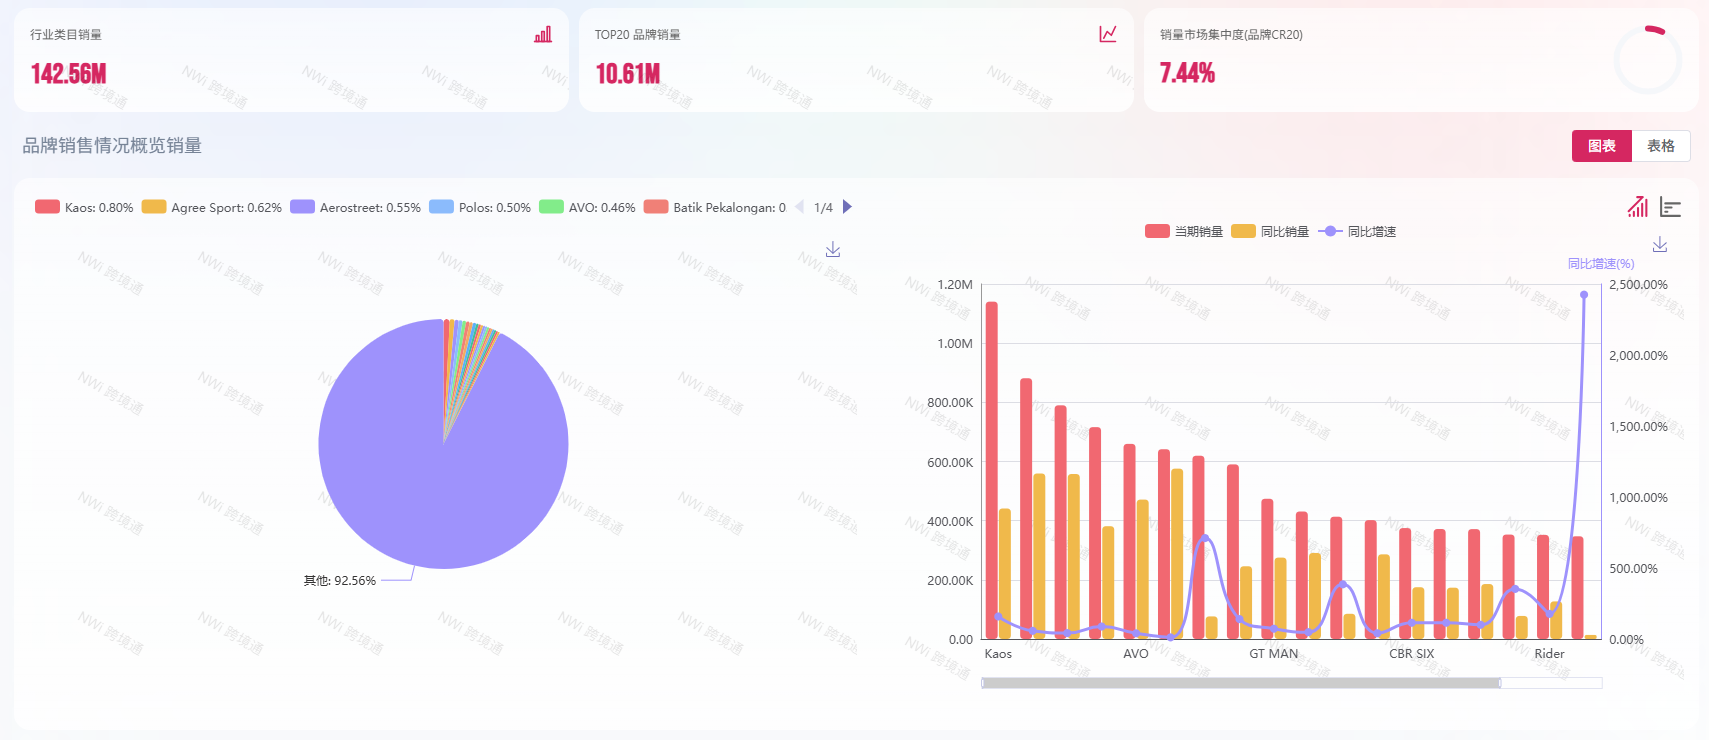
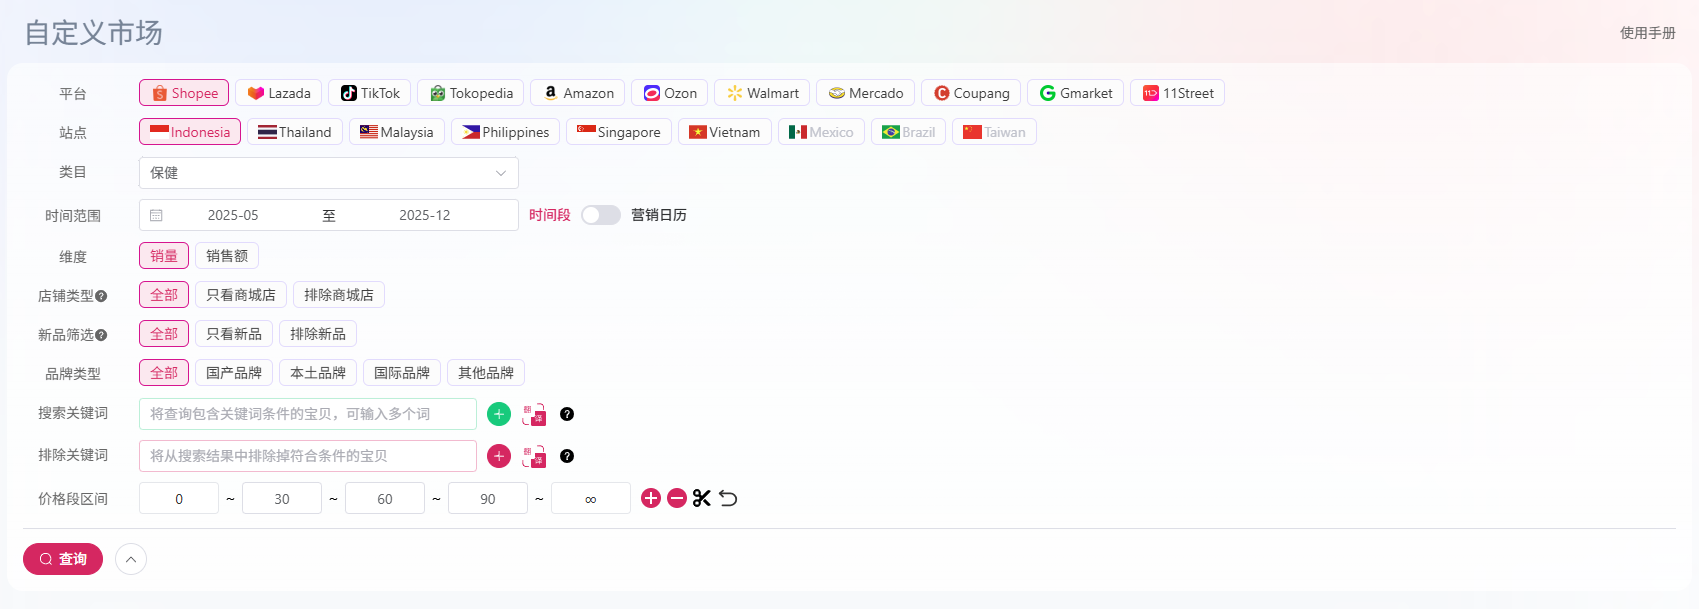
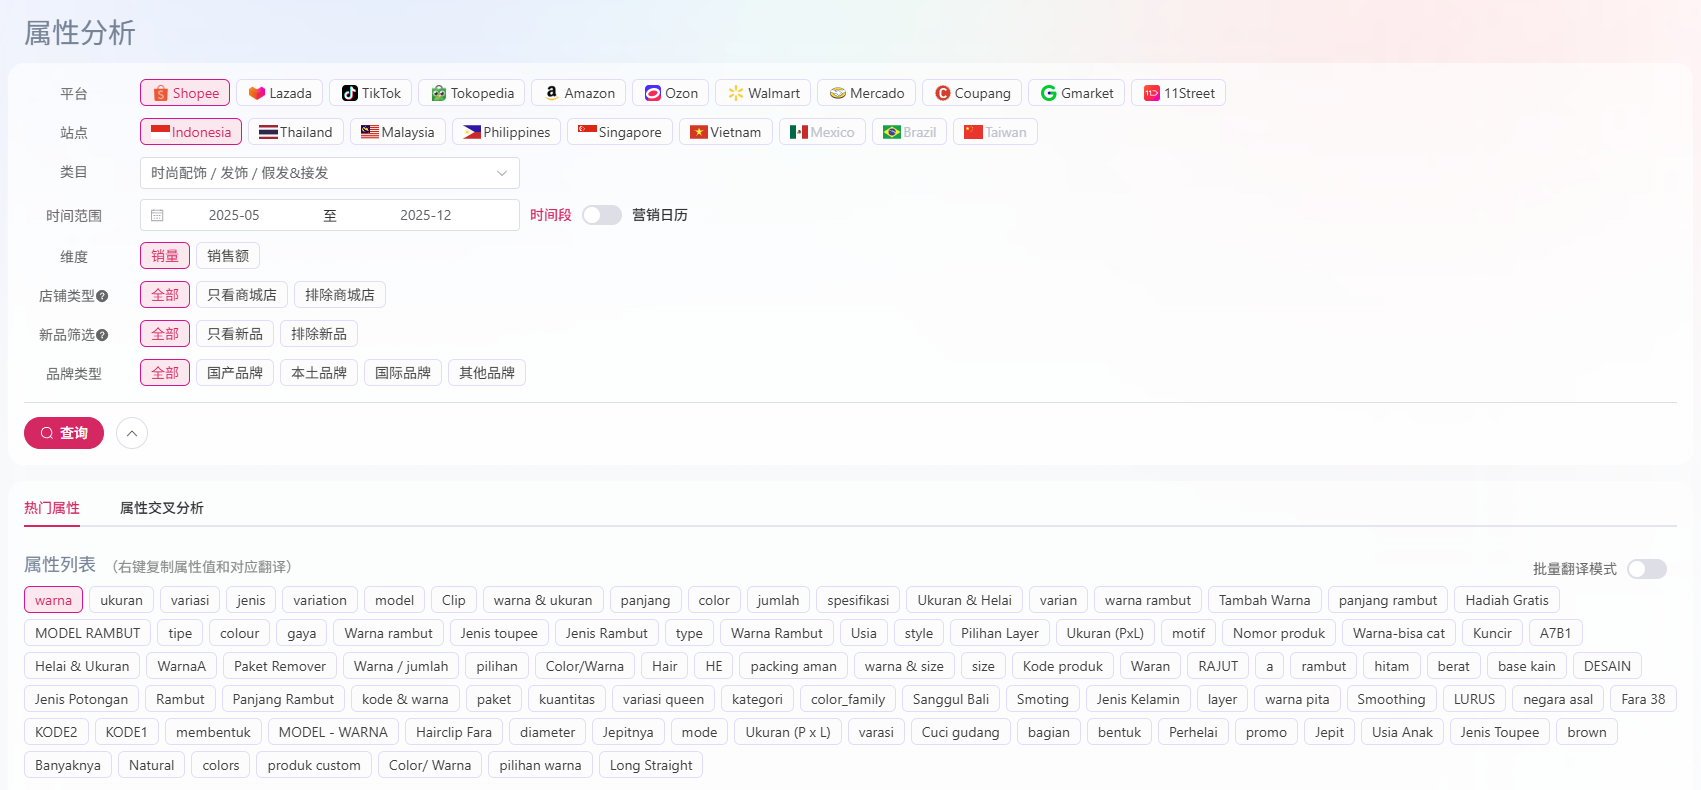
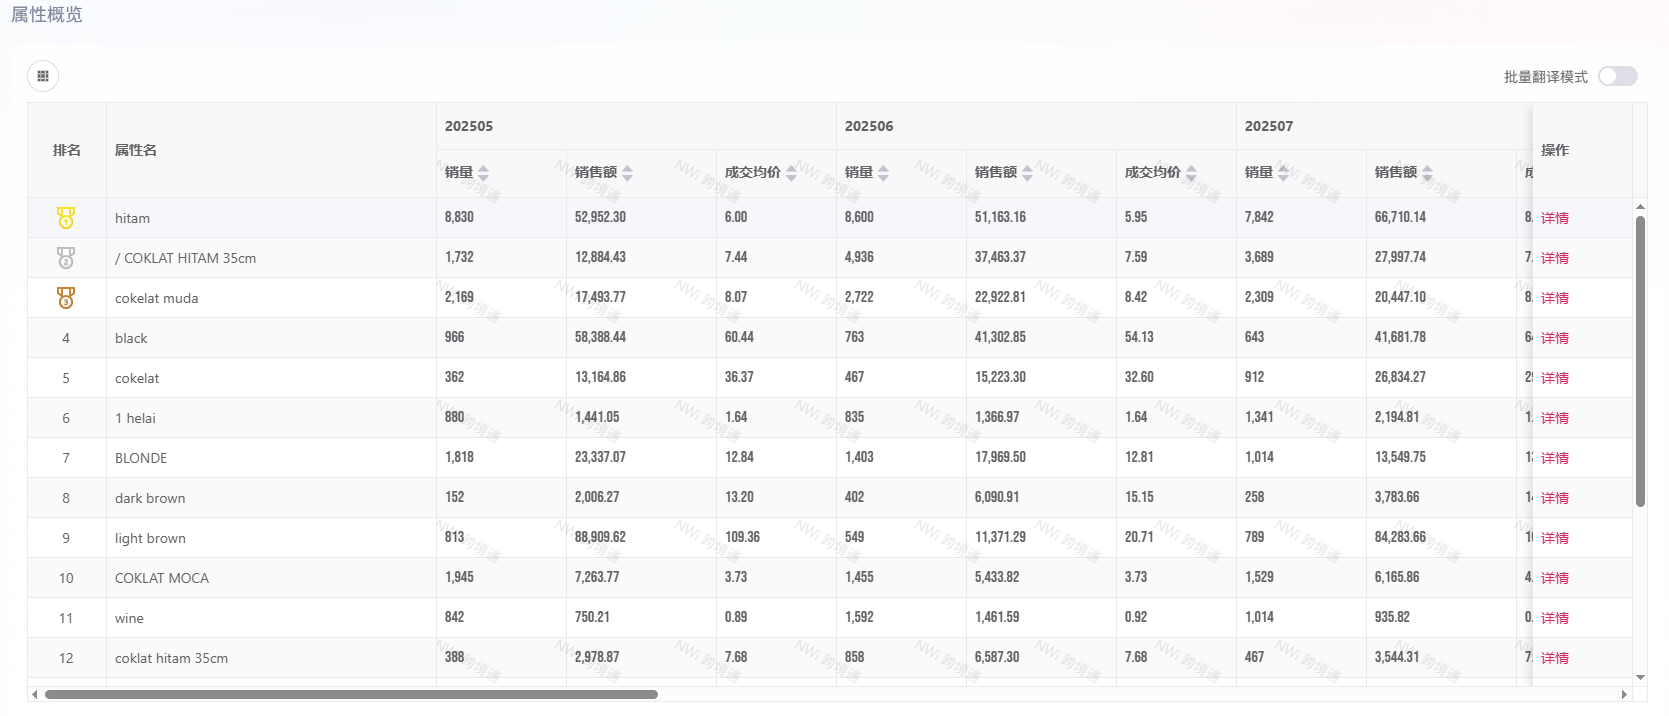
Figure A: Size overview and filters

Use platform/site filters to review category scale and stage-level changes quickly.

Market trend decomposition
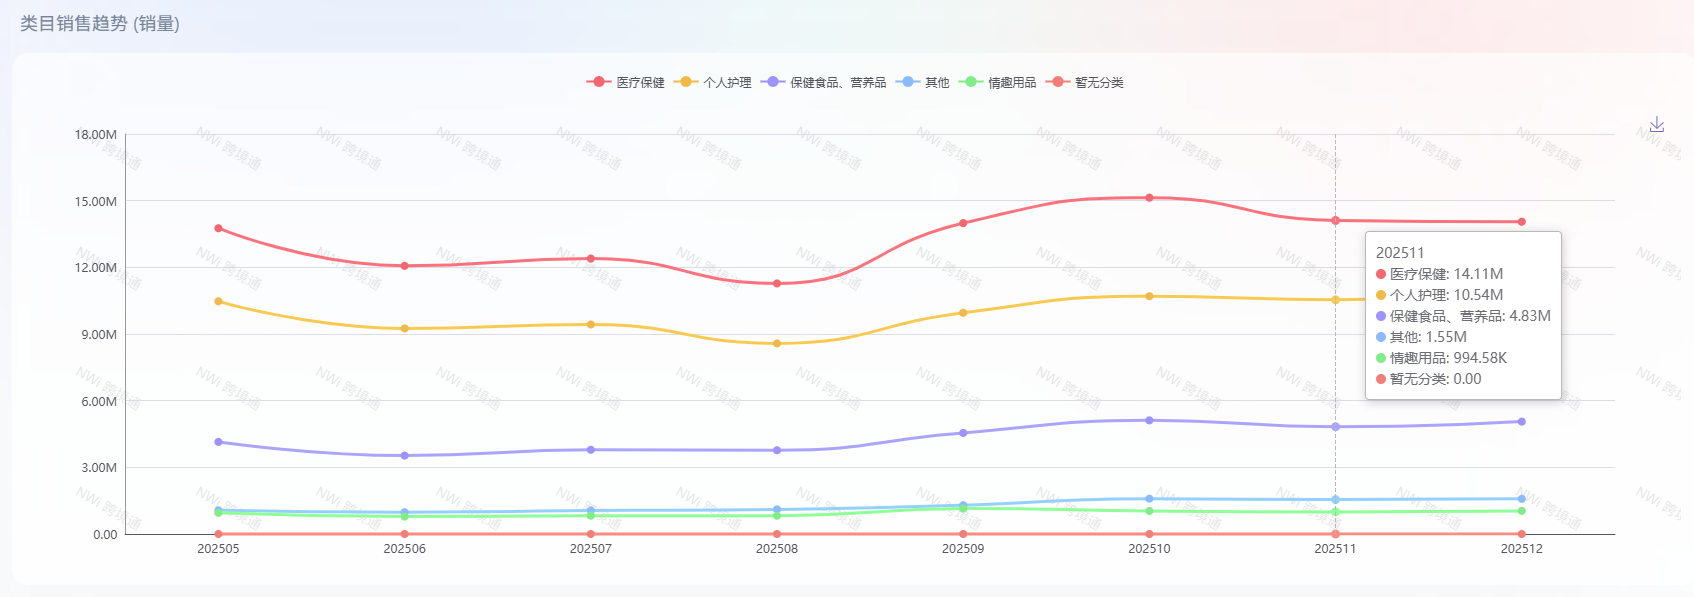
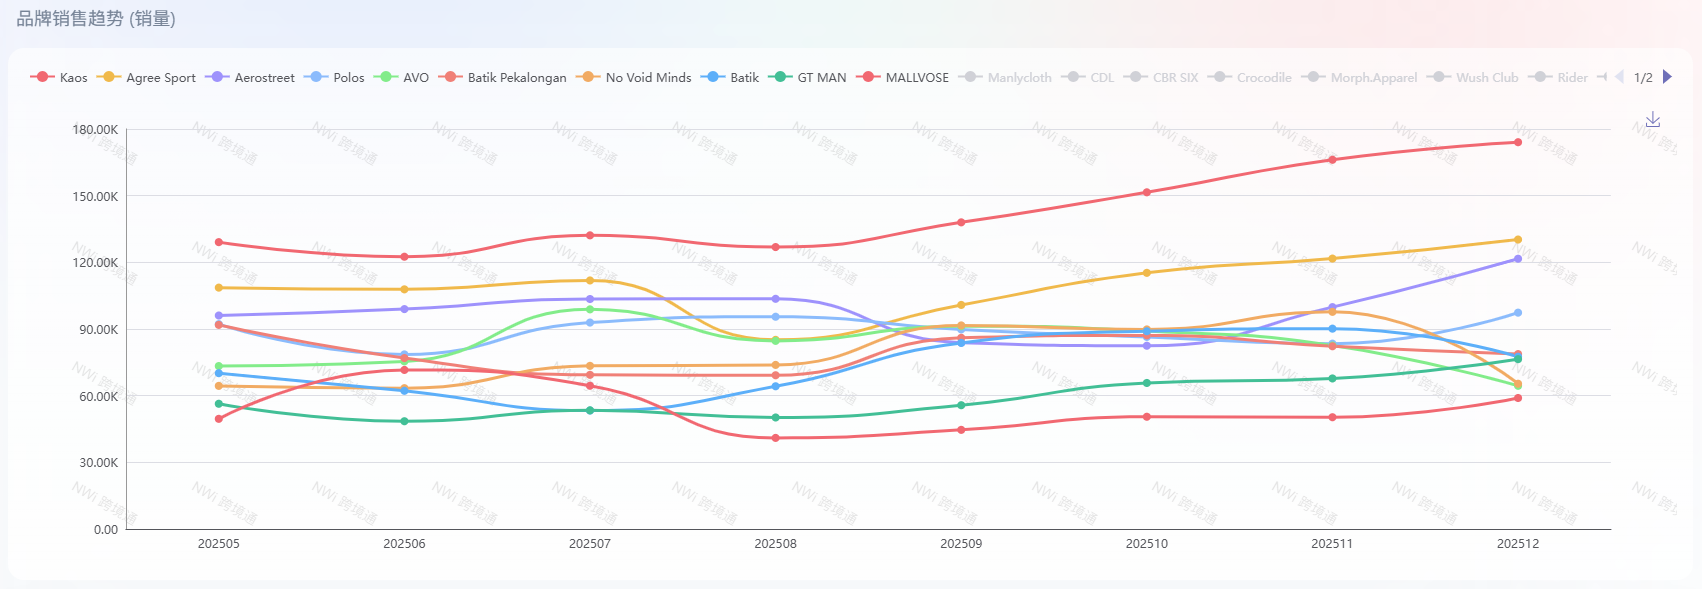
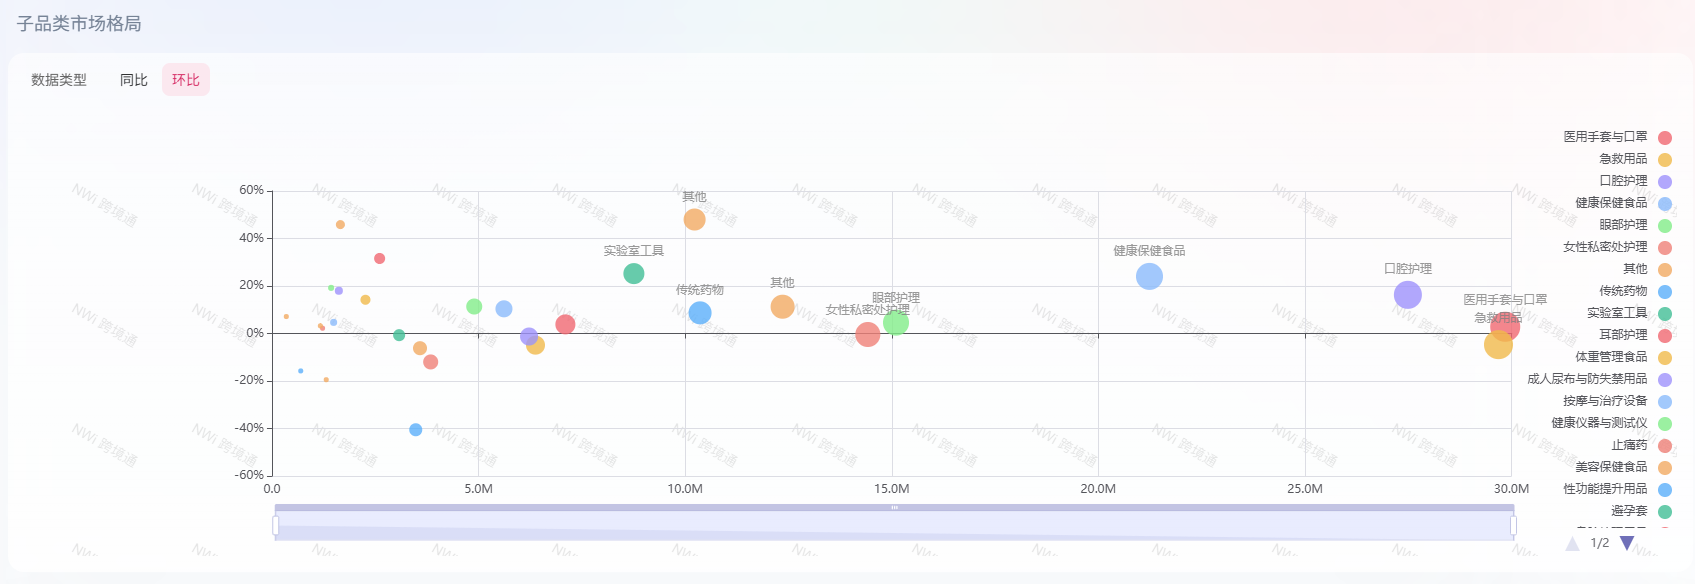
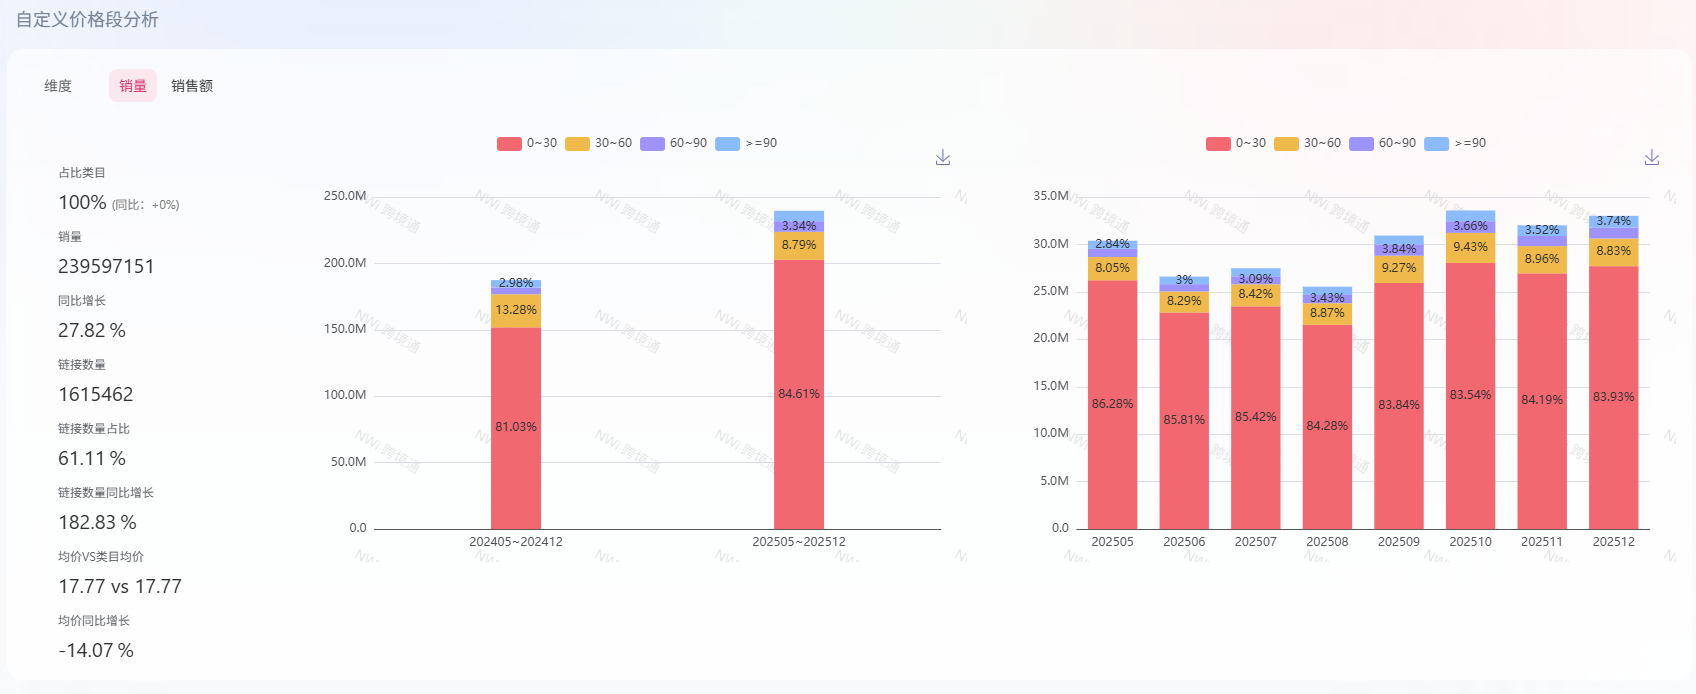
Figure B: Trend and structure split

Combine total trend with share structure to improve market cycle judgment.

Top brand leaderboard
Figure C: Brand ranking and key metrics

Aggregate brand sales, GMV, and YoY changes to identify leading tiers.

Brand trend comparison
Figure D: Brand trend comparison

Track ranking shifts over time and evaluate growth durability.

02 / Top Brands

Identify leader structure and change paths

Review sales scale, YoY speed, concentration, and timeline in one view to spot stability, acceleration quality, and catch-up windows.

03 / Top Stores

Track store performance and operation quality

Take stores as the unit to evaluate sales, GMV, ASP and trend volatility. Identify high-quality operators for benchmarking.

Top store leaderboard
Figure E: Top stores leaderboard

Reveal stores with stronger operational efficiency and sustained growth.

Top products leaderboard
Figure F: Top products leaderboard

Break down product-level sales structure and locate growth-driving SKUs.

04 / Top Products

Find the real drivers behind category growth

Focus on product-layer velocity to identify key SKUs and price bands that actually move market growth and assortment optimization.

05 / Subcategory Structure

Understand share distribution and structural migration

Decompose subcategories and evaluate competitive status with both share and growth, then prioritize the most promising tracks.

Subcategory structure
Figure G: Subcategory composition

Spot high-potential subcategories by share and concentration split.

Subcategory trend migration
Figure H: Subcategory trend migration

Read structural movement over time and detect turning points early.

Custom market filters
Figure I: Custom market filters

Combine platform, site, keywords, and more to build target markets.

Custom market output
Figure J: Saved market outputs

Persist outputs into reusable market pools for repeat analysis.

06 / Custom Market

Build a business-fit market with multi-condition filters

Assemble specific markets by platform, site, brand/store type, keywords, and price range to match real operating scenarios.

07 / Attribute Analysis

Find category opportunities from attributes

Use attribute cross-analysis and overview metrics to identify high-impact feature combinations for product, content, and media strategy.

Attribute term analysis
Figure K: Attribute term performance

Detect which attribute terms most influence performance outcomes.

Attribute value cross analysis
Figure L: Attribute value cross insight

Locate feature combinations with stronger commercialization potential.

Ready To Start

Validate Industry Insights Faster

Ready to test these insights in your own target market?
Start a trial now and run decisions against live category signals.

Intelligence for Global Growth, Power for Global Expansion
Hotline:
Business Collaboration:
Business Inquiry
NWi Business Inquiry
Contact
Contact NWi
Scan the QR code to contact us
NWi
Copyright©2023-2025 诺舟数智市场咨询(上海)有限公司